This Month in TYPO3: October 2025 [Issue #30]
Awards season is buzzing as nominees head to Düsseldorf, a side-by-side content preview shows how budget ideas become features, and TYPO3 Camp London…

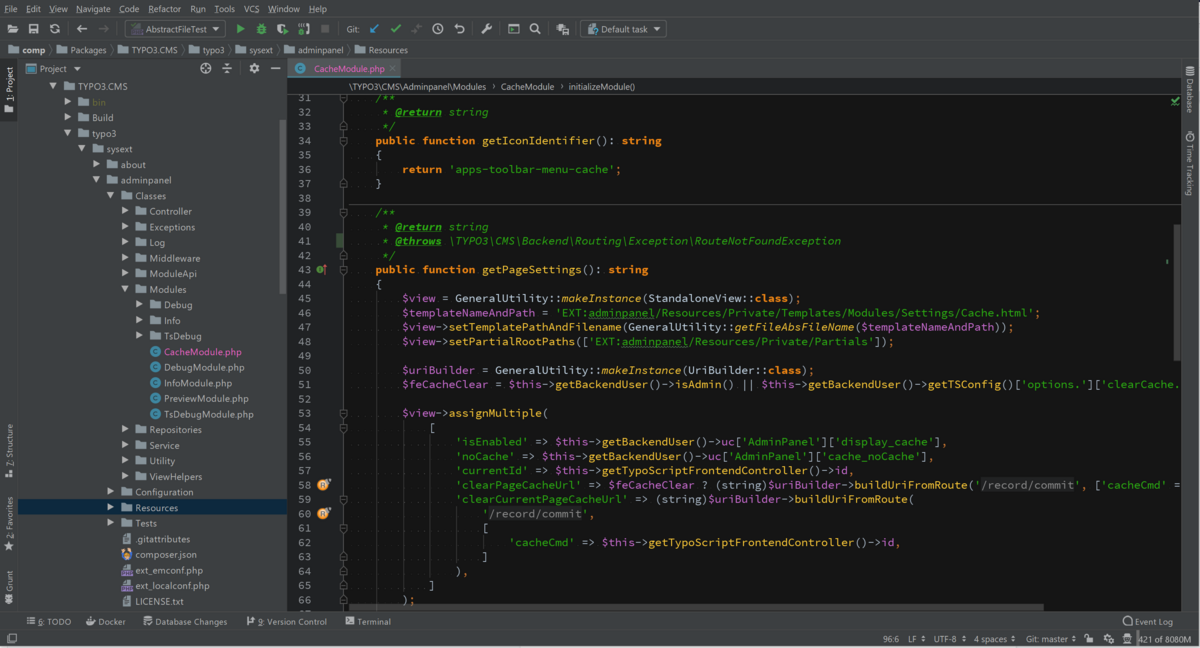
In my opinion it’s a decent IDE especially when using it to its’ full extent. The first important point I want to make is PhpStorm is an IDE, not just an editor. Meaning it might be overkill to use it for simple text editing tasks where other tools like Atom or VSCode are positioned. When using it for PHP development, however, there is little that’s missing and few tools I’ve encountered can match the feature set.
When you are trying PhpStorm—or working with it—consider these tips to make the most of it:
… and I don’t mean copy and paste. PhpStorm can do many things that make your development faster—and nearly all of it can be mapped to a shortcut. Some of my most used shortcuts are
Additionally, I would recommend creating your own keymap for shortcuts with ones you can easily remember. I’m a big fan of two-key shortcuts—for example I have configured:
Live templates allow you to create custom shortcut code that expands to bigger snippets. For example writing “$apples.fe” and pressing tab results in “foreach ($apples as <cursor>) {}”. There are some configured by default but you can also add your own for code you use often.
With Code > Generate (or in my case Alt+Insert in a file) you can additionally generate some common code/comment parts like getters/setters, copyright notices, or PHPDoc.
Learn how to get around in your code base: Make use of Navigate to File/Class/Symbol, learn how to open the file browser at the location of any file with a shortcut, find out how to quickly switch between test and implementation and navigate between the usages and declaration of a method with no more than a keystroke. While it doesn’t make you a better programmer, it gets you where you want to be faster and makes it a lot easier to follow code structures—for example when debugging an issue.
Running tests inside the IDE has the advantage that you can directly jump to offending code if tests fail as the files are linked in the info window. Additionally, when generating coverage in the IDE you can highlight uncovered code lines in the editor, making it easy to see missing tests while staying focused on the code.
Last but not least: Use the debugger. Do not var_dump/echo your way through the code — you will be much more efficient with a debugger as you can see more context, see the stack trace as well as evaluate code at a specific point of time. For example, when setting a breakpoint the PhpStorm debugger console allows you to not only inspect the current context but also to execute PHP in that context — calling a method, evaluating a condition and whatever else seems necessary. It takes some time to get used to it, but once you do, it’s an amazing tool.

Aside from the core functionality PhpStorm provides, there are also some plugins I’m regularly using—both TYPO3 specific and not.
The one must-have plugin when developing TYPO3 with PhpStorm is the TYPO3 CMS Plugin. Its features include for example:
Cedric Ziel is providing the plugin for free and as open source, please consider donating if it’s useful for you.
Sgalinski is offering both a TypoScript and a Fluid plugin, providing auto-complete and code-formatting capabilities for both. The plugins are free with advertisement in a basic version. The premium version is ad-free and supports further development efforts. Read more about the TypoScript and Fluid plugins.
The plugin helps extract hard-coded strings to TYPO3 XLIFF files by simply highlighting the text and clicking extract. Helpful for those of us, who do labels last. Read more
CodeGlance adds a minimap for code as known from sublime to the editor. Besides the glance feature, for me it mostly provides a bigger scroll bar which I can’t miss. Read more
With .editorconfig it’s possible to enforce project coding standards without everyone having to carefully configure their editors or IDEs. The plugin adds support for .editorconfig to PhpStorm (also used by the TYPO3 core). Read more
One of my favorite plugins is PHP Inspections. It’s extending the IDE with further analysis capabilities focused on possible bugs, performance issues, security and maintainability. There are multiple versions and pricing tiers—I’m currently using the ultimate edition and satisfied with it. Many thanks to Vladimir who provided three licenses for us to use through a twitter raffle. Find out more about the plugin.
Last but not least I’m using the plugin Run Configuration as Action to allow assigning shortcuts to run configurations (for example specific test run configurations—see my love for shortcuts above). It’s a free plugin. Read more
That’s it. I hope my small overview of how I’m using PhpStorm has been helpful (and again thanks to Jetbrains for supporting Open Source Development).
Are you using PhpStorm, too? If so leave a comment. What’s your favorite part or plugin?
Proofreading: Tony Lush
Awards season is buzzing as nominees head to Düsseldorf, a side-by-side content preview shows how budget ideas become features, and TYPO3 Camp London…
In this article, Łukasz Uznański outlines the design, development journey (including UX experiments and pitfalls), and practical scenarios for…
Each month, we celebrate TYPO3 contributors in our Developer Appreciation Day post. Please take a moment to share gratitude for their continued…
The TYPO3 Marketing Team wrapped up its final sprint of the year in Berlin on 22 October 2025. The team came together to collaborate on concepts,…
We’re pleased to announce ERGO by Lüftner and Parili as Patron Sponsor for the TYPO3 Conference 2025 (25-27 November 2025).
On the first Monday in September, it was time again for our Remote Day. The Best Practice Team and interested developers met to work together,…