Advanced Fluid Debugging With the kreXX Debugger Extension

Categories: Development Created by Tobias Gülzow
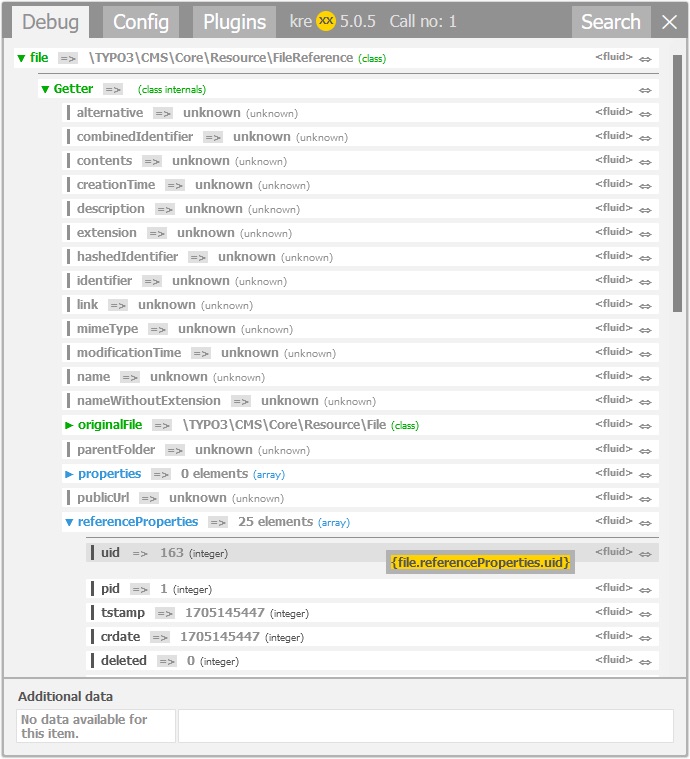
Screenshot of debugging information from a content management system, displaying fields like alternative, description, and file properties, with most values marked as unknown.
This article describes the usage of the kreXX Debugger extension. It addresses limitations in Fluid's f:debug templating engine by offering advanced debugging features such as getter analysis, logging, code snippet generation, and much more.

TYPO3 uses Fluid as a templating engine to render the website frontend. The TYPO3 v13 LTS release will use Fluid v4. TYPO3 will provide the f:debug ViewHelper to assist integrators with this task. Modern templating engines like Fluid increasingly rely on objects, which traditionally use getter methods to supply templates with values. However, these methods may not be visible in the f:debug ViewHelper because it only displays class properties.

Getter Debugging

The main problem with f:debug is that it doesn’t resolve getter methods for objects; it simply looks at class properties and displays them. In contrast, the kreXX Debugger extension analyzes object methods. Rather than calling these methods directly, it determines their potential return values by inspecting the class structure and parsing the source code.

The advantage is clear: You cannot access something that you do not know about. The kreXX Debugger extension helps TYPO3 integrators and developers uncover all available options, providing a code snippet to reach the desired value.

Beyond Normal Getters

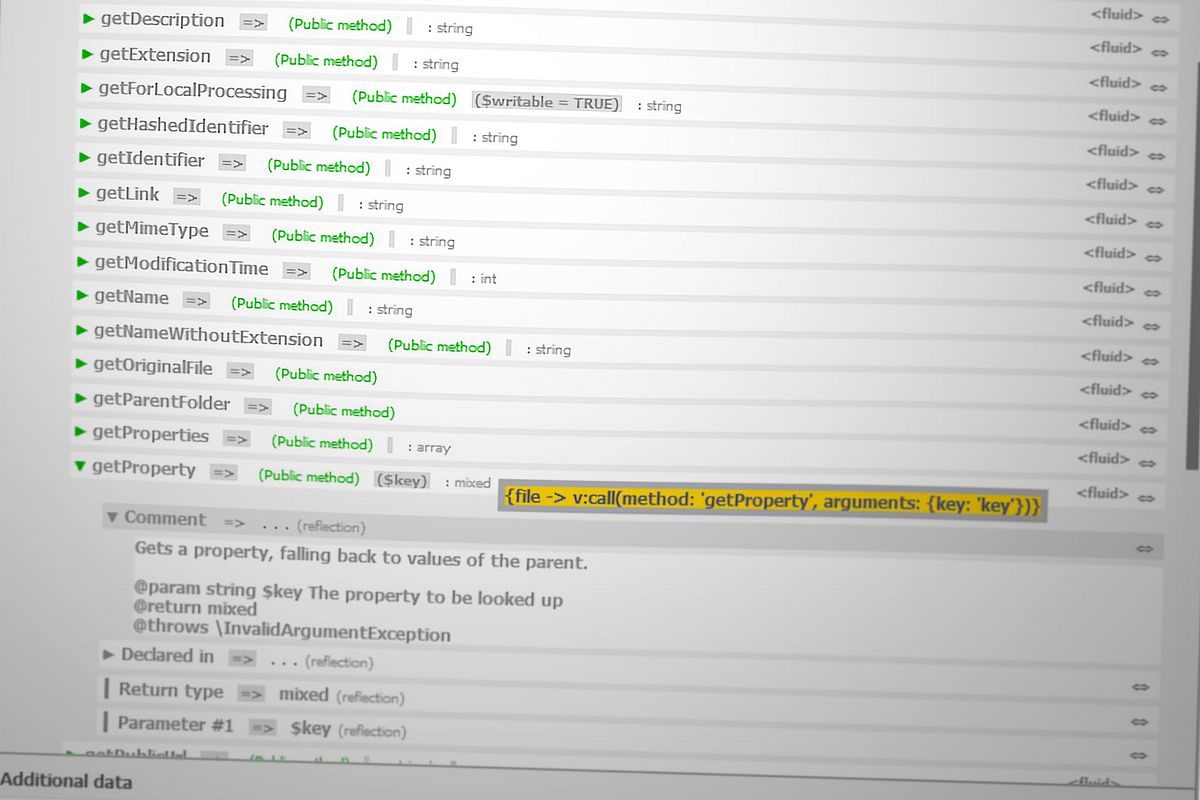
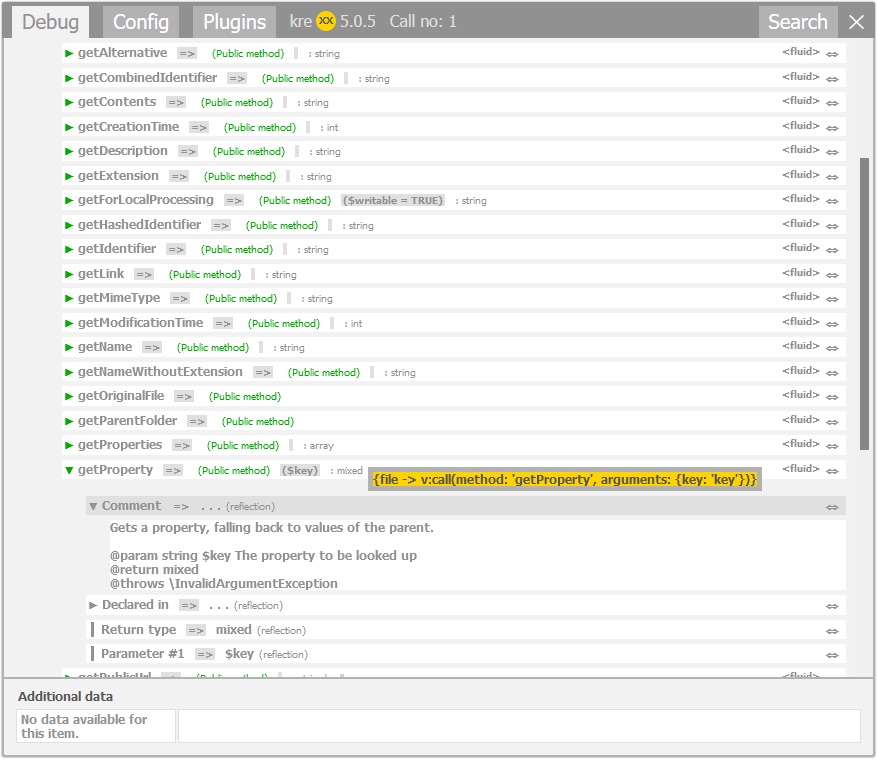
Just because a method name starts with get doesn’t mean it can be used in a Fluid template. Methods requiring parameters cannot be used directly. However, with VHS installed, this is no longer an issue. The kreXX Debugger extension generates the code to call these methods and provides additional data about them.

Simply copy the generated snippet into your template and fill in the argument values.

Usage

There is no need to declare the Fluid namespace in the file header — the kreXX Debugger extension is ready to use after installation.

For debugging we have two ViewHelpers:

  • krexx:debug — Sends everything directly to the frontend (unless configured otherwise).
  • krexx:log — Creates a log file, which is accessible in the backend module or the admin panel.

Installation in Development-Only Context

Debugging a live site is generally a bad idea. This will only lead to trouble.

You can install the kreXX Debugger extension on your local DDEV by simply adding includekrexx as a development requirement:

ddev composer require --dev brainworxx/includekrexx

If your deployment process uses Composer, it must use

composer install --no-dev

to make sure that no development software will get installed on the live system.

Finally, a Git Hook blacklisting the word krexx is helpful to prevent any debug statements getting deployed.

Access Logfiles

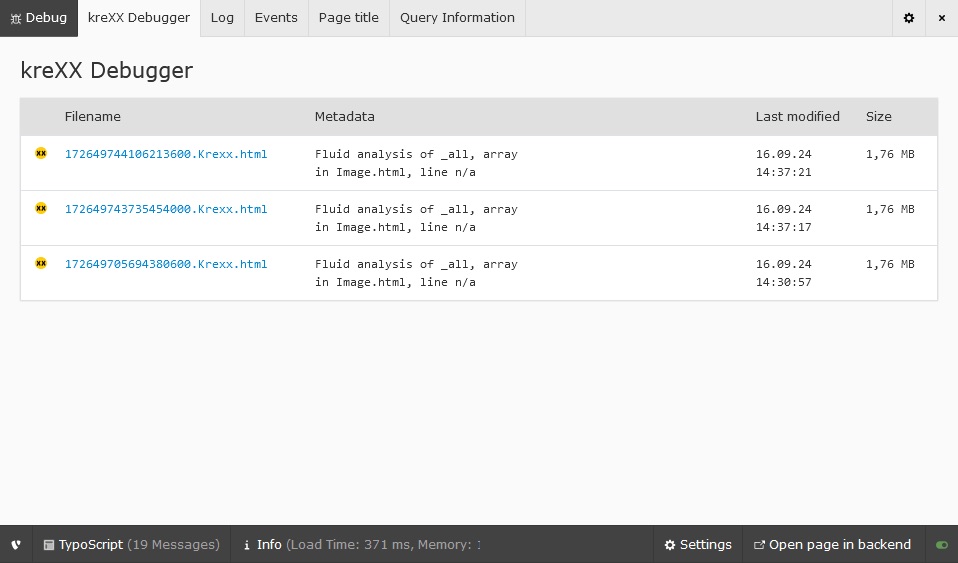
The logfiles are easily accessed in the backend module. The file list offers some meta data about the file and will be updated as soon as new files are available.

If you don't want to use the backend module, you can also use the integration in the admin panel.

Configuration

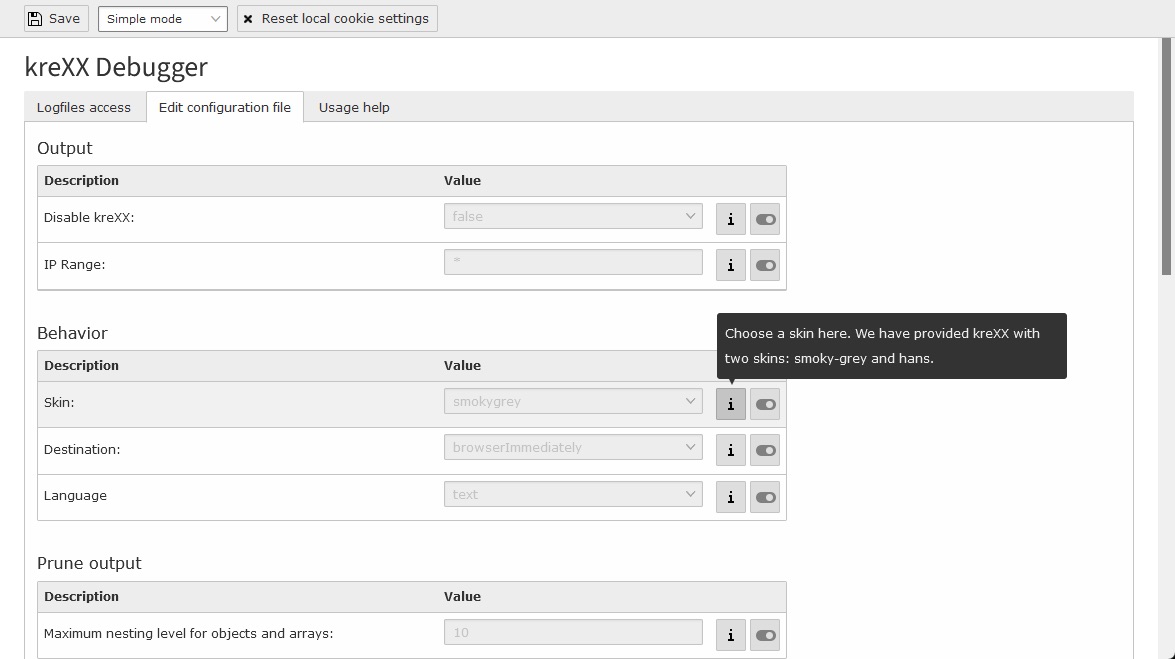
The kreXX Debugger extension comes preconfigured which should cover most use cases. But if you want, you can change all settings in the backend module. There is a popup on the [i] button with a short explanation text about each setting.

Inspiring People To Share

The kreXX Debugger extension has been around for over 10 years, originally as a PHP debugger. Development of the fluid debugger started with v1.3.3 back in June 2015 and was finished with v2.2.0 in April 2017.

Software is only as good as the feedback it receives. If you want to test the kreXX Debugger extension, you can help us improve by reporting bugs and suggesting features on our GitHub issue tracker.

Find the kreXX Debugger extension here:

Additional contributors for this article
  • Copy Editor : Felicity Brand
  • Content Publisher : Mathias Bolt Lesniak